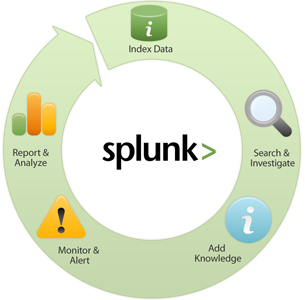
Splunk for Cognos?

Was reading about Splunk the other day. I’ve heard about it a few years ago and recent post by Altis Consulting made me revisit their site. Basically, it’s a logs aggregator on steroids with search capabilities and nice dashboards. And it’s Big Data, heh )
Given that it’s not so hard to add a app / reader for Cognos BI logs (we all know their structure, right?) and there are already apps for JMX, J2EE servers, Windows and *nix servers, you can get realtime stats on: * Cognos errors (for example, BIBus processes terminating) * CPU and memory stats * JVM metrics * Tomcat / WAS stats on all servers in your Cognos cluster.
And they’ll be available for post-error forensics. And real-time monitoring dashboard in your browser. Then I thought, that would look a lot like Accelatis )
Adding TM1 logs shouldn’t be a huge issue as well. And if you could tap into Operations Console stats (possible with Java API, I would guess), that would close the loop for TM1 as well. Just imagine: client operations and CPU / memory usage on the same screen. And spanning back a few days to avoid “was working better” conundrums )
PS: I’ve spent a few weeks tying nmon logs from an AIX box to Cognos BI logs and adjusting settings on both for max performance and would’ve loved something integrated back then.